What Is OEE?
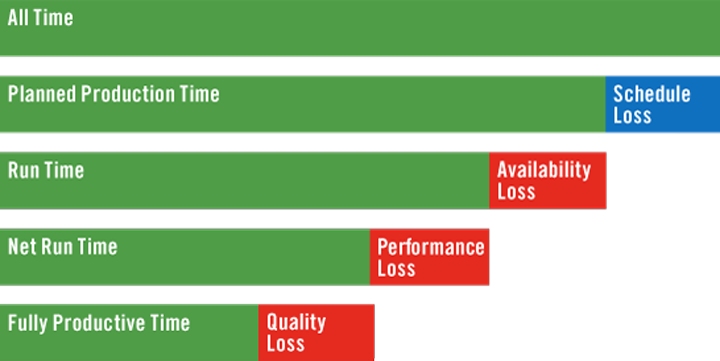
OEE (Overall Equipment Effectiveness) is a “best practices” metric that identifies the percentage of planned production time that is truly productive. An OEE score of 100% represents perfect production: manufacturing only good parts, as fast as possible, with no down time.
OEE is useful as both a benchmark and a baseline:
As a benchmark it can be used to compare the performance of a given production asset to industry standards, to similar in-house assets, or to results for different shifts working on the same asset. As a baseline it can be used to track progress over time in eliminating waste from a given production asset.

So as a benchmark, what is considered a “good” OEE score?
An OEE score of 100% is perfect production: manufacturing only good parts, as fast as possible, with no stop time. An OEE score of 85% is considered world class for discrete manufacturers. For many companies, it is a suitable long-term goal. An OEE score of 60% is fairly typical for discrete manufacturers, but indicates there is substantial room for improvement. An OEE score of 40% is not at all uncommon for manufacturing companies that are just starting to track and improve their manufacturing performance. It is a low score and in most cases can be easily improved through straightforward measures (e.g. by tracking stop time reasons and addressing the largest sources of down time – one at a time).
Calculating OEE – Simple
So how is the OEE score calculated?
In simplest terms, OEE is the ratio of Fully Productive Time to Planned Production Time. In practice this is calculated as:
OEE = (Good Count × Ideal Cycle Time) / Planned Production Time
Let’s define some terms:
Good Count (pieces that are manufactured without any defects)
Ideal Cycle Time (the theoretical fastest possible time to manufacture one piece)
Planned Production Time (the total time that the production asset is scheduled for production)
Fully Productive Time (producing only good pieces, as fast as possible, with no stop time)
Calculating OEE – Preferred
The preferred way to calculate OEE is mathematically equivalent to the simple formula described above, but provides a much richer understanding of waste in the manufacturing process by breaking it down into three loss factors:
Availability Loss
Performance Loss
Quality Loss
- - - - -
Loss Categories of Simple OEE:
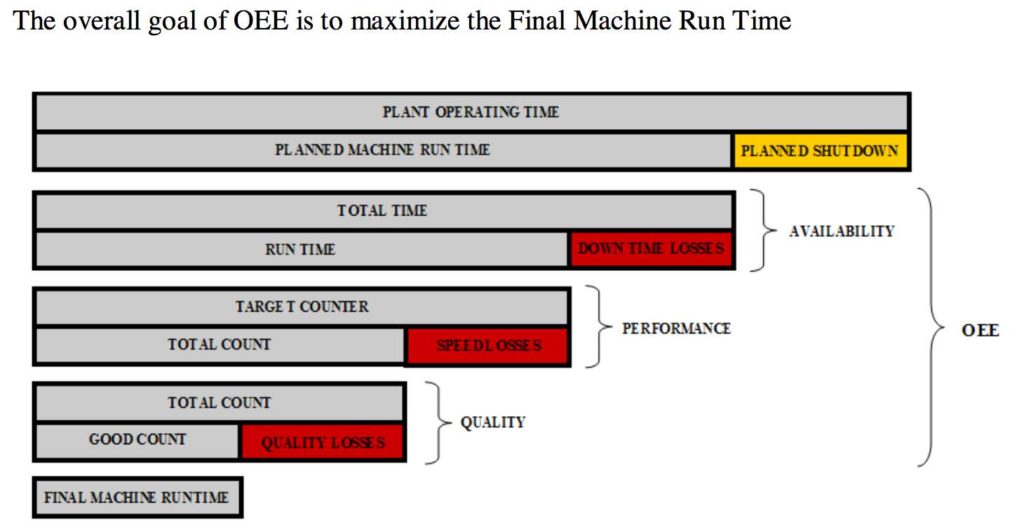
On the previous page, we explained that the three Loss Categories reduce the Planned
Run Time of the machine. Listed below in Table 1 are the three Loss Categories (Down Time, Speed, and Quality) of Simple OEE and examples of events that can occur in aproduction process of a machine to reduce productivity. These Loss Categories contribute to lowering the overall Simple OEE value of the machine.
Simple OEE
Loss Category
Simple OEE Metric
Loss Category Examples
Down Time Losses
Availability
- Equipment Failures
- Tooling Damage
- Unplanned Maintenance
- Process Warm Up
- Machine Changeovers
- Material Shortage
Speed Losses
Performance
- Product Misfeeds
- Component Jams
- Product Flow Stoppage
- Level of Machine Operator Training
- Equipment Age
- Tooling Wear
Quality Losses
Quality
- Tolerance Adjustments
- Warm Up Process
- Damage
- Assembled Incorrectly
- Rejects
- Rework
Table 1 (Loss Categories)
Definition of OEE:
Overall Equipment Effectiveness (OEE) is a way to monitor and improve the efficiency of your manufacturing process. Developed in the mid 1990’s, OEE has become an accepted management tool to measure and evaluate plant floor productivity. OEE is broken down into three measuring metrics of Availability, Performance, and Quality.
These metrics help gauge your plant’s efficiency and effectiveness and categorize these key productivity losses that occur within the manuf acturing process. OEE empowers manufacturing companies to improve their processes and in turn ensure quality, consistency, and productivity measured at the botto m line.
By definition, OEE is the calculation of Availability, Performance, and Quality.
- OEE = Availability x Performance x Quality
Metric 1: Availability
- Availability = Run Time / Total Time
By Definition: Percentage of the actual amount of production time the machine is running to the production time the machine is available.
Simple OEE: The total run time of the machine subtracting all unplanned downtime.
Metric 2: Performance
- Performance = Total Count / Target Counter
By Definition: Percentage of total parts produced on the machine to the production rate of machine.
Simple OEE: How well a machine is running when it is running.
Metric 3: Quality
- Quality = Good Count / Total Count
By Definition: Percentage of good parts out of the total parts produced on the machine.
Simple OEE: How many good parts versus bad parts a machine has produced.
Simple OEE Terminology:
This section describes the various plant manufacturing terms that make up Simple OEE and the three metric values (Availability, Performance, Quality) used in the calculation of Simple OEE.
Availability takes into consideration any Down Time Losses
- Run Time - The total production time that the machine has been running and producing parts.
- Setup Time - The period of time on the machine required for an operator to perform all the necessary tasks to produce the first good part.
- Down Time - The period of time the machine is not available for production due to maintenance or breakdown
- Total Time - The total accumulated machine time of Run Time + Down Time + Setup Time.
Performance takes into consideration any Speed Losses
- Target Counter - the number of parts or cycles that should be completed at a particular point within th e shift, day, or production run.
- Total Count - The total number of parts, good and bad, that are produced on a machine.
Quality takes into consideration any Quality Losses
- Total Count - The total number of parts, good and bad, that are produced on a machine.
- Good Count - The input count for any part produced to manufacturing specifications on the machine.
Calculations
- Availability = Run Time / Total Time
- Performance = Total Count / Target Counter
- Quality = Good Count / Total Count
Simple OEE begins with Planned Machine Run Time and with reductions from the three metrics, Availability (Downtime Losses), Performance (Speed Losses), and Quality (Quality Losses) determines the Final Machine Run Time.